Software Engineering for Ajax - Part 2
Software Engineering for Ajax - Part 2
Ryan Dewsbury
 Digg This
Debugging in Eclipse
Eclipse provides a nice environment for debugging a running Java application. When you run a GWT application in hosted mode, Eclipse runs it as a Java application and you can debug it within Eclipse. This ability to debug a browser-based web application is a huge advancement for the Ajax development process.
Earlier in this chapter you saw that an Eclipse launch configuration can be automatically created by the GWT applicationCreator script by using the -eclipse option when creating the application. You can launch the application in hosted mode from Eclipse using either the Run or Debug command. When launched, the application runs in the hosted mode browser. In Debug mode, the hosted mode browser is connected to Eclipse and can use Eclipse's debugging commands.
First, let's look at breakpoints. Breakpoints allow you to set a location within your code where, when reached, the application running would break and pass control to the debugger . This lets you inspect variables or have the application step through the code line by line to analyze the program flow. To see how this works, add a breakpoint to the HelloWorld application on the first line of the button's ClickListener.onClick method by right-clicking on the left margin of that line in the editor and selecting Toggle Breakpoint, as shown in Figure 4-24.
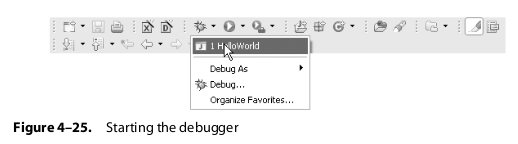
You'll see the breakpoint added represented by a blue circle in the margin. Alternatively, you can double-click the same spot in the margin to toggle the breakpoint. Now when you debug the application, Eclipse will break into the debugger when it reaches the breakpoint. In this case it will happen when you click on the button. Start the debugger by opening the Debug menu from the Bug icon on the toolbar and selecting HelloWorld, as shown in Figure 4-25.
When the HelloWorld application opens in the hosted mode browser, click on its Click Me button to see Eclipse display the debugger. You should see Eclipse in the Debug perspective, as shown in Figure 4-26.
This is the view you should become familiar with if you are going to be building an Ajax application of any decent size. It provides you with a working view of exactly what is going on in your application. If your application exhibits strange behavior, you can set a breakpoint to see exactly what is happening. If you are a JavaScript developer, this type of debugging tool may be new to you and seem somewhat complex. However, it is definitely worth the effort to learn how to use it properly, since it will save you a lot of time when finding bugs. Instead of printing out and analyzing logs, you can set a breakpoint and step through the program one line at a time, while checking variable values, to determine what the bug is.
Let's briefly look at some of the tools in the Debug perspective. First of all, there are the controls that sit above the stack. The Resume and Terminate buttons are the green triangle and red square, respectively. Resume lets the program continue running. In Figure 4-26 it is stopped on the breakpoint. The Terminate button ends the debug session. You typically end your program by closing the hosted mode browser windows; however, when you are in a breakpoint, the application has stopped and you cannot access the interface of the hosted mode browser. The only way to end the program in this case is to use th e Terminate button. The yellow arrows next to the Resume and Terminate buttons are used for stepping through the application. Taking a step when the application has stopped on a breakpoint executes one step. This allows you to see how one step of code affects any variables. It also lets you inch your way through the program and at a slow pace see how it flows. The first step button, Step Into, takes a step by calling the next method on the current line. Typically this will take you to another method and add a line to th e stack. You would use this button when you want to follow the program flow into a method. To avoid stepping into another method, use the next step button, Step Over, which executes the current line, calls any methods, and stops on the next line in the current method. The third yellow arrow button, Step Return, executes the rest of the current method and returns to the calling method, where it stops.
Underneath the debug controls is the calling stack. (A calling stack is a list of methods calls in an application, where each item on the stack is a method preceded by its calling method. So, for example, when a method completes, control returns to the calling method on the top of the stack.) This is actually a tree that lists threads in the Java application with their stacks as children. The stacks are only visible if the thread is stopped on a breakpoint. Ajax applications are single threaded, so we only need to worry about the one thread and its stack. When we hit the breakpoint in the onClick method, the single JavaScript thread displays its method call stack with the current method highlighted. You will find the stack particularly helpful to see when and how a method is called. You can click on other methods in the stack to look at their code in the editor. When you browse the stack like this, the Debug perspective adjusts to the currently selected line on the stack. For example, the editor will show the line in the selected method where the child method was called. It will also adjust the Variables view to show the variables relevant to the currently selected method.
The Variables view lists local and used variables in the current method. The list is a columned tree that lets you browse each variable's contents, and if it is an object, displays its value in the second column. An area on the bottom of the view displays text for the currently selected variable using its toString method.
Sometimes stepping through an application with breakpoints isn't enough to find and fix problems. For example, an exception may occur at an unknown time, and placing a breakpoint would cause the debugger to break perhaps thousands of times before you encountered the exception. This is obviously not ideal. Fortunately, Eclipse provides a way to break into the debugger when a specific exception occurs. To add an exception breakpoint you simply need to choose Run > Add Java Exception Breakpoint. This displays the dialog shown in Figure 4-27.
In this dialog you select the exception you'd like to break on. The list is a dynamically updating list filtered by the text entered. Figure 4-27 shows breaking on Java's ArrayIndexOutOfBoundsException. After clicking on OK, you can see that the breakpoint was added by looking at the Breakpoints view in the Debug perspective shown in Figure 4-28.
To test this, let's write some code that will cause an index to be out of bounds:
Now when running the application in Debug mode, Eclipse breaks when this code tries to write to the 1,001 st int in the array (if you bump into another out-of-bounds exception when trying this, press the Resume button). Figure 4-29 shows the Debug perspective stopping on the exception breakpoint.
Notice that the current line is the line where the out of bounds exception occurs. The value of i can be seen in the variables window as 1000 (arrays start at 0, so index 1,000 is the 1,001st item and over the bounds which was set at 1,000 items). The benefit of this type of breakpoint is that we did not need to step through 1,000 iterations of the loop to see where the problem is. Of course this is a trivial exampl e, but you can apply this technique to more complex examples that exhibit similar behavior.
Now that we know we have a bug in our HelloWorld code, we can use another great feature of Eclipse that a llows us to update the code live and resume the application without restarting. With the application stopped at the exception breakpoint, let's fix the code so that it looks like Figure 4-30.
We've set the comparison operation to less than instead of less than or equals, and removed the 1,000 value to use the length property of the array. Save the file, resume the application, and then click the Refresh button on the hosted mode browser. You' ll see that the application runs the new fixed code and does not encounter the exception. This technique saves quite a bit of time which would otherwise be spent restarting the hosted mode browser. Also, reducing breaks in your workflow helps keep your mind on the task at hand.
URL:
 Find a programming school near you
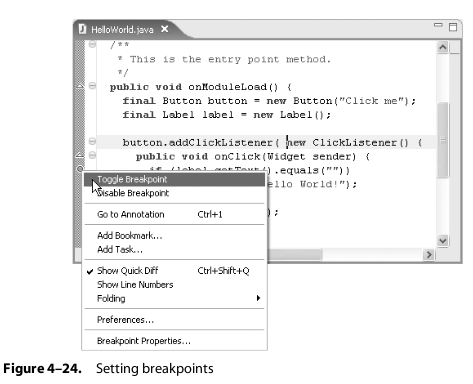