Debugging JavaScript Using Venkman, Part 2
Debugging JavaScript Using Venkman, Part 2
If you're looking for more than a rudimentary debugger for your JavaScript code, look no further than Venkman. It's a full-fledged debugging environment incorporating tools that most programmers take for granted in other programming languages, and is designed to deliver cross-browser JavaScript compatible code. The best part is that it's freely available, and if you have a recent copy of Mozilla or Netscape on your system, you may already have it and not know about it.
The previous article looked at where you could find Venkman and some of its basic functionality. This article goes further and shows how you can actively use it in your JavaScript development.
Finding Out What's Wrong with Your Code
Let's say you've created some simple DHTML code, but it isn't working, and you haven't been able to figure out what's wrong. If you're surfing a page using Internet Explorer, you get a little yellow warning icon which, when you click on it, provides you with a simple analysis of what's wrong, and the line number at which your script breaks down. The problem with this; is that it's not always where the real problem lies (as anybody who has used this to debug their code more than a couple of times will know). While the code may fail at the point that Internet Explorer indicates, the real problem - a misnamed variable, an incorrect value being passed along, or something else - could just as well lie elsewhere, and probably is. This is where Venkman shines.
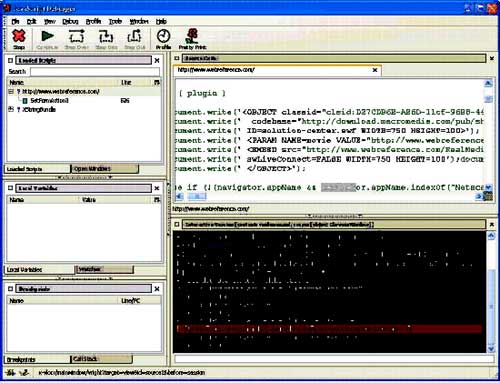
To get started with Venkman, go to the page you wish to inspect using a recent copy of Mozilla and then from the Tools menu select Development, and then JavaScript Debugger (the official name for Venkman). In the top-left window labeled Loaded Scripts you should see the URL for the page, along with any other linked scripts it finds on the page. Click the URL and it will reveal all of the JavaScript functions on the page. Each function is denoted by a little blue box, followed by the name for the function, and then the line number where it is referenced. Double-click on a function and Venkman will take you directly to the code referenced by that line number in the Source Code window. This is a handy way to locate the various functions in your code.
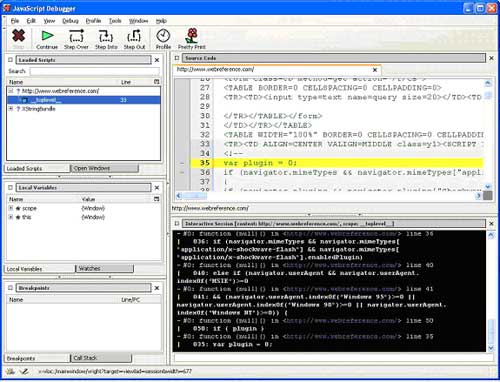
In order to start debugging, you need to switch out of this mode by clicking the Open Windows tab that appears alongside Loaded Scripts. This should also display the URL for your target page. Right-click on the URL and select Set as Evaluation Object. This targets the code on the page in the Interaction Session window, which should now show display the URL as the current selected context. To discover the values of various objects on this page, you can simply type in their corresponding JavaScript reference. No matter what page you're on, if you type in frames, you should get back [object Window] as a response, and if you have any images on your page typing in document.images ought to bring back [object HTMLCollection]. If you have any content, document.body ought to return [object HTMLBodyElement]. If you don't get the last message at the very least, something is seriously wrong with your Web page. ;-)
Using this you can change the state of the objects on this page for testing purposes. For example, if you wanted to play a somewhat mean trick on the browser, you can type in Navigator.appName = "Internet Explorer". You may get an error message at this point. If not, try typing in Internet Explorer and you will see that the browser dutifully reports back that it is no longer Mozilla but Internet Explorer. If you are looking at a page that does not actively use Navigator.appName = "Internet Explorer" you can expect an error message in your Interactive Session window, saying essentially that it is not accessible in this case. From this simple demonstration, you can get an idea as to the power behind Venkman and how it can be used.
Your Code Step by Step
One of the most useful features of Venkman is where you can stop JavaScript (from running), then visually step through its execution on the page. You can do this by clicking the Stop button (the one with the big red "X" on it), which stops the execution of any scripts currently running on the page. At this point you've likely run into a Catch-22 situation - since you're within Venkman, when you hit the button, the chances are good that your Web page has already executed all of the JavaScript on a page (unless of course you have a loop running, waiting for input from the user). Go back to your target page, hit reload, and you'll find that Venkman pops up immediately. Highlighted in yellow in the Source Code window is the first line of JavaScript on the page that was trying to execute, with much the same information displayed in the Interactive Session window. If you look back at your page in Mozilla, you'll see exactly where your page has stopped loading - if you've got JavaScript embedded in the header, you can expect a blank page. Back in Venkman you'll also notice that the Stop button is now inactive, and the buttons following it - Continue, Step Over, Step Into and Step Out - are now active. Hit the bright green Continue button and the rest of your Web page will load, displaying the end results in the Interactive Session window.
The key to learning your way around the debugger are the three Step buttons, which guide you step-by-step through the JavaScript execution process on the page. The Step Into button takes you through the processing of a function line by line, Step Out takes you out of the current function and into the next, and the Step Over button jumps over the currently executed function and on to the next, if there is one. Using these buttons you can see exactly how - and more importantly, where - your functions are being executed on the page. Note that even when you step over the function, it is still executed - it is simply skipped over by Venkman in its display.
Created: March 27, 2003
Revised: October 31, 2003
URL: https://webreference.com/programming/javascript/venkman/2
 Find a programming school near you